Ap Stats Discrete and Continuous Sample Problems
PROBLEMS ON DISCRETE AND CONTINUOUS DATA
Definition :
A quantitative variable is one which has a numerical value and is often called a numerical variable. This information collected is called numerical data.
Types of quantitative variable :
(i) Discrete variable
(ii) Continuous variable
Discrete variable :
Discrete variable takes exact number values and is often a result of counting.
Examples :
The number of people in a household:
The variable could take the values 1, 2, 3,...
The score out of 30 for a test :
The variable could take the values 0, 1, 2, 3, ..., 30.
Continuous variable :
Continuous variable takes numerical values within a certain continuous range. It is usually a result of measuring.
Examples :
The weight of newborn babies :
The variable could take any positive value on the number line but is likely to be in the range 0.5 kg to 7 kg.
Problem 1 :
20 students were asked "How many TV sets do you have in your household?" and the following data was collected:
2, 1, 0, 3, 1, 2, 1, 3, 4, 0, 0, 2, 2, 0, 1, 1, 0, 1, 0, 1
a) What is the variable in this investigation?
b) Is the data discrete or continuous? Why?
c) Construct a dot plot to display the data. Use a heading for the graph, and add an appropriate scale and label to each axis.
d) How would you describe the distribution of the data? Is it symmetrical, positively skewed or negatively skewed? Are there any outliers?
e) What percentage of the households had no TV sets?
f) What percentage of the households had three or more TV sets?
Solution :
(a) Variable in this investigation is number of TV sets in the house hold.
(b) It is discrete data.
(c)
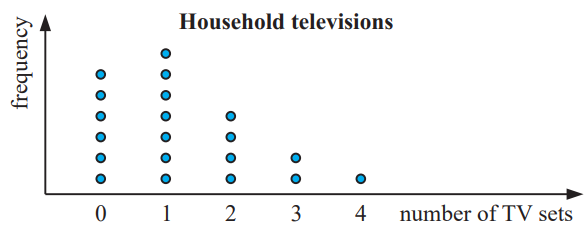
(d) Positively skewed and there is no outliers
(e) Number of students who have no TV sets = 6
Percentage of students who have no TV sets
= (6/20)⋅ 100%
= 0.3(100%)
= 30%
(f) Number of students who have 3 or more TV sets = 3
Percentage of students who have 3 or more TV sets
= (3/20) ⋅ 100%
= 15%
Problem 2 :
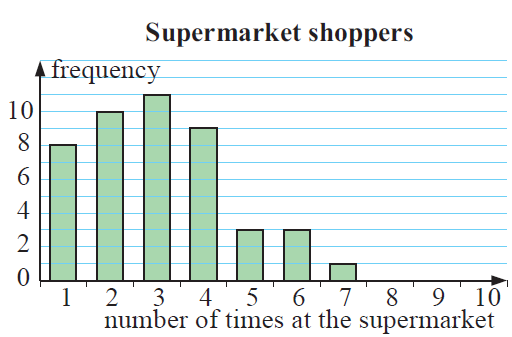
A randomly selected sample of shoppers was asked, 'How many times did you shop at a supermarket in the past week?' A column graph was constructed for the results.
a) How many shoppers gave data in the survey?
b) How many of the shoppers shopped once or twice?
c) What percentage of shoppers shopped more than four times?
d) Describe the distribution of data ?
Solution :
(a) Number of shoppers = 8+10+11+9+3+3+1
= 45 shoppers
(b) Height of bars 1 and 2 is 8 and 10 respectively.
So, number of shoppers shopped once or twice is
= 8 + 10
= 18
(c) More than 4 means, 5, 6 and 7 times.
Number of shoppers for 5 times = 3
Number of shoppers for 6 times = 3
Number of shoppers for 7 times = 1
So, 3 + 3 + 1 ==> 7 times
7 shoppers has been shopped more than 4 times.
Percentage of shoppers shopped more than 4 times
= (7/45)⋅ 100%
= 15.5%
So, approximately 16%.
(d) The distribution is positively skewed and no outliers.
Problem 3 :
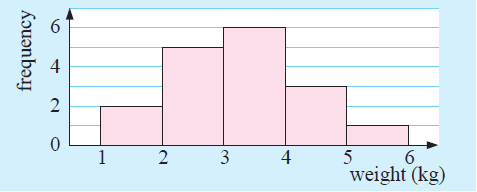
The weights of parcels sent on a given day from a post office were, in kilograms :
2.9, 4.0, 1.6, 3.5, 2.9, 3.4, 3.2, 5.2, 4.6, 3.1, 2.8, 3.7, 4.9, 3.4, 1.3, 2.5, 2.2
Organise the data using a frequency table and graph the data.
Solution :
Since the given data is weight, it is continuous data.
| Weight 1 to 2 2 to 3 3 to 4 4 to 5 5 to 6 | Frequency 2 5 6 3 1 |
A frequency histogram is used to graph this continuous data.

Apart from the stuff given above , if you need any other stuff in math, please use our google custom search here.
Kindly mail your feedback tov4formath@gmail.com
We always appreciate your feedback.
© All rights reserved. onlinemath4all.com
Source: https://www.onlinemath4all.com/problems-on-discrete-and-continuous-data.html
0 Response to "Ap Stats Discrete and Continuous Sample Problems"
Post a Comment